![]()
![]()
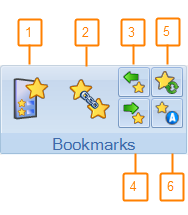
Use bookmarks to mark measurement graphics that are of interest for easy retrieval at a later stage.
Lesion segmentations as well as other measurement graphics such as line, ROI, square, rectangle, oval, freehand, curve measurement and arrow are marked as bookmarks.
NOTE: In Lesion Segmentation, you typically mark graphics that serve to measure a lesion in both the prior and the current study. It is recommended to register the two studies before you perform the bookmarking, so that when you view a bookmark in one study, the other study displays the matching image and bookmark.
All bookmarks created in a study are stored when the study is dismissed and will be available when the study is loaded again in the future.
To change bookmark-related settings, click Graphics and Measurements in Applications Settings and then click Configure Bookmarks Settings.
# |
Description |
1 |
Bookmark List Show and hide the Bookmark List window. |
2 |
Define Follow-Up Set Define an association between two bookmarks marking two occurrences of the same lesion or general finding in two different studies. |
3 |
Previous Bookmark Navigate to the previous bookmark on the bookmark list. The viewer focuses on the previous bookmark of the selected study. |
4 |
Next Bookmark Navigate to the next bookmark on the bookmark list. The viewer focuses on the next bookmark of the selected study. |
5 |
Synchronize Bookmarks Use Synchronize Bookmarks to synchronize the study bookmarks in the database without the need to dismiss and reload the study. |
6 |
Automatically Mark as Bookmark Automatically mark graphic as bookmark. When this icon is activated (highlighted yellow), graphics you draw, including line, ROI, square, rectangle, oval, freehand, curve measurement and arrow, are automatically marked as bookmarks. |
NOTE: The Bookmark ribbon also appears in the Graphics tab.
You can associate bookmarked occurrences of the same lesion in different studies to create a Follow-Up set. Follow-Up sets allow you to follow and accurately assess changes in a lesion’s size and volume over time.
NOTE: The number of studies participating in a Follow-Up set is not limited.
1. Display the two studies with the two occurrences of the bookmarked lesion.
2. Click
the Define Follow-Up Set icon ![]() . The cursor changes its shape,
displaying the digit 1.
. The cursor changes its shape,
displaying the digit 1.
3. Bring the mouse over to the bookmark of the first study. The cursor changes its shape.
4. Click once on the bookmark. The cursor indicates FII.
5. Bring the mouse over to the second bookmark in the second study. The cursor changes its shape, displaying the digit 2.
6. Click the bookmark.
An annotation appears next to the bookmarks indicating the Follow-Up set name.
Alternatively, you can right-click on a bookmark, select Define Follow-Up Set and select a bookmark in another study.
NOTE: Bookmarks of different types may be associated in a Follow-Up set (for example, graphic line and a liver lesion). The graphic line type is changed to Lesion and the line’s length is considered as the lesion’s long diameter.
NOTE: It is not possible to create Follow-Up sets of bookmarks that are part of the same study
NOTE: It is possible to merge two Follow-Up sets provided that the sets do not contain common studies.
Once the bookmarked lesions are associated, the Follow-Up column in the Bookmark List window is populated with the name of the Follow-Up set.
When the bookmarks in the Bookmark List window are displayed in a follow-up layout, the bookmarks are arranged by Follow-Up set. Bookmarks that are not part of any Follow-Up set do not appear in that layout).
NOTE: Clicking on a bookmark in a Follow-Up Set navigates to the bookmark location in the linked groups, and not to the physical location.
NOTE: Similar to bookmarks, Follow-Up sets are also stored for later use.
NOTE: If Follow-Up sets exist between the current study and prior studies, loading only the current study to the viewer will also retrieve all bookmarks from prior studies that participate in these Follow-Up sets.
When you add a measurement (bookmark) to one of two registered groups and then add another measurement in the same anatomical area in the other registered group, the system creates an automatic follow-up set. The first time you perform this action, a message appears, allowing you to enable or disable this automatic linking feature. Subsequently, messages appear every time an automatic follow-up set is created to inform you that the system has created the set. You may then view the follow-up set details in the Bookmark List.
To break a Follow-Up set by detaching a bookmark from it, right-click a bookmark and select Detach from Follow-Up. The bookmark itself is not deleted and the graphic/lesion change does not change in any way.
Click the Synchronize Bookmarks icon ![]() to synchronize the study bookmarks in the database without the need to
dismiss and reload the study.
to synchronize the study bookmarks in the database without the need to
dismiss and reload the study.
When synchronizing bookmarks, the system:
Saves new or modified bookmarks to the database
Loads and displays any bookmark added or changed since the study was loaded
This feature is useful when more than one user is working on a study and one user wants to see changes made by the other user.
Foe example, an attending doctor adds bookmarks to a study from their station and has the resident see these changes to create hyperlinks to the new bookmarks in the report without closing the study.
All bookmarks you create are listed in the bookmark list. Clicking on a bookmark in the bookmark list displays the image that contains that bookmark in the viewer.
To open the bookmark list, click the Bookmark
List icon ![]() . The Bookmark
List window displays a list of all bookmarks created in the current
session or in the past in the loaded studies (current and prior):
. The Bookmark
List window displays a list of all bookmarks created in the current
session or in the past in the loaded studies (current and prior):

# |
Description |
1 |
List of bookmarks created in the loaded studies. Click a column header to sort the list by that column (in ascending or descending order). Drag a column to a different location in the window to change the columns’ order. Drag a column above the table to hide it. |
2 |
Customize Columns Click Customize Columns to display a list of possible column headers you may add to the bookmark list. |
3 |
Layout Select the Study Layout option to arrange the bookmarks in the list by study. The yellow title row displays information about the study, including study date, study description, time from baseline, and total Metabolic Tumor Volume (MTV) of the study. Select the Follow-up option to arrange the bookmarks in the list by Follow-Up sets. Expand the Follow-Up set (click the minus sign near the Follow-Up set name) to display the bookmarks constituting that set. |
4 |
Select Show Bookmarks on Images to display all bookmarks created in the study on the viewer images. Select Show Only Mine to show only those bookmarks created by you. |
5 |
Baseline Study The study with which length and volume measurements are compared. By default, the earliest study serves as the baseline and the bookmarks are compared with bookmarks in that study. Click the drop-down menu to change the baseline study, that is, determine a later study as the study with which measurements are compared. |
6 |
Bookmark Report Click the Bookmark Report icon to open the bookmark report, which presents summary information about all bookmarked findings, including size, volume and changes over time compared with the baseline study. |
The following fields display as columns in the Bookmark List window:
Field |
Description and Additional Information |
Creator |
Name of physician who created the bookmark. |
Type |
An indication of whether the bookmark marks a lesion or another type of graphic. Categories can be either General or Lesion. |
Sub-type |
Bookmarks belonging to the Lesion type can be sub-classified to Liver, Lung, Lymph or Other (that is, lesions that are not tissue-specific). You may change the sub-type to a different one. For example, you may change Other to Liver. |
Tool |
The tool that was used to create the bookmark (for example, line, oval, segmentation). |
Date |
The date on which the bookmark was created or modified. |
Bookmark Name |
The name given by the system to the bookmark. |
Slice # |
The number of the slice on which the bookmark was created. |
Series |
The series containing the slice with the bookmark. |
Long diabmeter |
The length of the lesion’s long diameter. |
Short diameter |
The length of the lesion’s short diameter. The short diameter is the axis drawn perpendicularly to the long axis at the point of the longest possible short diameter. |
RECIST Diameter |
The reported diameter (either the long or the short diameter). |
Volume |
The lesion’s volume. |
Volume Error |
The percentage of error, based on inclusion or exclusion of the lesion surface volume. |
SUV Max |
The maximal Standardized Uptake Value (SUV) in the ROI/VOI. |
SUV Mean |
The mean Standardized Uptake Value (SUV) in the ROI/VOI. |
SUV Peak |
The SUV Peak found in the ROI/VOI. |
HU Mean |
The mean Hounsfied value in the ROI/VOI. |
Pixel Max |
The maximal pixel value in the ROI/VOI. |
Pixel Mean |
The mean pixel value in the ROI/VOI. |
Pixel Sum |
The sum of the pixel values in the ROI/VOI. |
Days from Baseline |
For bookmarks that are part of a follow-up, this column shows the number of days elapsed from the date of the baseline study and the date of the study containing this bookmark. |
TLG |
Shows the Total Lesion Glycolysis (TLG) value of the lesion (mean SUV multiplied by the Volume). NOTE: For TLG calculation, SUV is calculated using the Lean Body Mass (LBM) method (SUV-LBM is also known as SUL). |
MTV |
Indication of whether or not this bookmark should be included in the MTV value. |
DT (days) |
The calculated doubling time of the lesion’s volume. |
Target |
RECIST classification of lesions signifies lesions as Target (a measured lesion to be examined in the study), Non-Target (lesions whose presence has been noted but are not included in the clinical study), Non-Target Non-Measureable (lesions that cannot or are not measured), New Lesion, and Unspecified. |
Area |
Calculated two-dimensional area of a lesion. |
Bookmark Description |
A general free description. (A default is given by the system.) |
Length |
The length of a line bookmark. |
Report |
Indication of whether or not this bookmark should be included in the report. |
Reviewed |
An
indication of whether or not this bookmark has been reviewed by
the user. Lesions created by the Lesion Tracking tool are initially marked as Non-reviewed. Editing a non-reviewed lesion marks it as Reviewed. |
Study Date |
Date of study creation. |
You may change the order of the columns or add columns to those displayed in the list window by default.
1. Click Customize Columns at the top right corner of the window. The Customization window appears.
2. From the Customization window, drag the desired column to the column header area of the Bookmark List window.
By default, the list of bookmarks within each study is sorted by series number and then by the number of the slice (image) carrying the bookmark in the series. However, you may change this default by clicking any of the column headers. The list is sorted by that column.
Right-click a bookmark in the Bookmark List window and select Delete Bookmark, or select the bookmark itself in the viewer, right-click and select Delete. You can also select more than one bookmark, right-click and select Delete Selected Bookmarks.
1. Draw a graphic on the image.
2. Right-click the graphic and select Mark Graphic as Bookmark.
Or
Click Automatically Mark as Bookmark ![]() in the toolbar.
in the toolbar.
An annotation with the bookmark name appears next to the graphic.
NOTE: Graphics drawn with the Automatically Mark as Bookmark icon activated (highlighted yellow) are always marked automatically as bookmarks.
If you are not interested in saving changes you have made to bookmarks (for example, you have moved a graphic inadvertently), you may dismiss the study without saving the changes.
To unmark a specific bookmark, right-click the graphic and select Unmark graphic as bookmark.
To unmark the bookmark and delete the graphic, right-click the graphic and select Delete and Remove Bookmark.
To dismiss the study without saving changes to bookmarks, clear the Save Bookmarks option in the Dismiss Study menu in the Workflow tab.
Reports provide summarized information regarding all bookmarked findings in the currently loaded studies.
1. To
display the report, click the Bookmark
Report icon ![]() in
the Bookmarks List window. The Bookmark
report window displays in preview form, showing the report data.
in
the Bookmarks List window. The Bookmark
report window displays in preview form, showing the report data.
2. To see a preview of the final report, click Preview Report.
3. To save the report to the server, click Save Report. You can then access the report via the Archive Explorer.
The report (in its Preview form) includes the following sections.
Following the patient details, the report displays study information (for example, study date).
Underneath the study date and name, the report displays the following figures:
· Number of days that have passed since the date of the study that was designated as the baseline study.
· Number of days that have passed since the previous exam.
The Target Lesions section presents summarized information of all bookmarked lesions designated as Target in the current study.
The Sum of Target lesions figure is a summation of all lengths of all long diameters in these lesions.
The Other Lesions section presents summarized information of all bookmarked lesions that were not designated as Target lesions.
The Findings section displays summarized information of bookmarked findings that are not lesions (that is, bookmarked findings created by a graphic tool such as line or oval and not by the Lesions tools).
The graphical presentation of the Target lesions shows the sums of all long diameters in the current and prior studies. The Y axis displays the diameters’ lengths sum and the X axis displays the prior and study dates.
This section displays follow-up information. Each row in the table represents a Follow-Up set and the lesion measurement data of each study included in the Follow-Up set is presented in a separate column. The data presented is volume, long diameter length, short diameter length and doubling time. For each of these parameters, the table presents the value and the percentage of change relative to the baseline study. For each study, the comparison is always with the values of the baseline study.